Bark scale
The Bark scale ( after Heinrich Barkhausen ) is a psychoacoustic scale for the perceived pitch ( tonality ). The scale is defined from 0.2 to 25 Bark.
A doubling of the Bark - value means that the corresponding sound is perceived as twice as high.
The Bark scale is linked to the critical band rate in Mel by Eberhard Zwicker. The following applies:
Are normalized both the Bark and Mel - scale on the musical note C (131 Hz). The following applies:
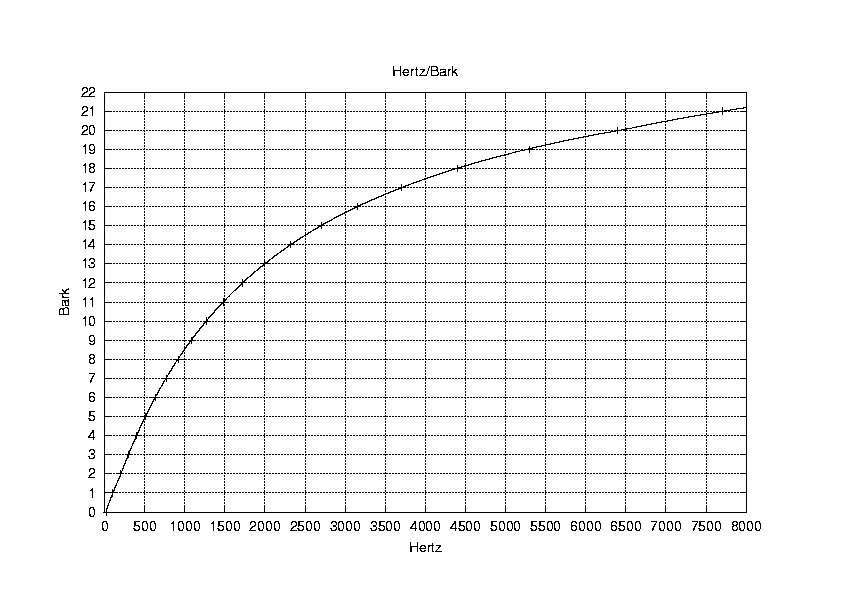
Relationship between Bark scale and frequency
The other correlations between frequency and Bark - value result, building on this through psychoacoustic experiments:
- At low frequencies below 500 Hz results in a nearly linear relationship: A tone at twice the frequency (one octave ) is found to be twice as high.
- For example, at 1000 Hz, a second sound to be perceived twice, must already have 4 times the frequency at 1600 Hz even a 10-fold the frequency: at higher frequencies more than 500 Hz, rather resulting in a logarithmic relation.
Diagrams, using the Bark scale instead of linear plotted frequency, thus corresponds to the better listening experience.
A frequency f can be converted into the corresponding Bark value z by the following formula: (Note: The formula is not exact: 131 Hz results in something more than 1.31 Bark )
After Traunmüller (1990 ) the critical bandwidth rate z is in Bark:
The critical bandwidth f in Hz can be calculated from z in Bark:
Approximate way, the relationship between frequency and Bark determine with the following rule:
- At frequencies below 500 Hz, a difference of one of an increase of the Bark frequency of about 100 Hz
- At frequencies above 500 Hz corresponds to a difference of 1 Bark an increase in the frequency of a minor third (ie by a factor of 1.19 ).
Bark scale and excitement of nerve cells in the inner ear
The sensation of pitch is directly dependent, are excited at what point in the inner ear nerve cells. In the inner ear, the basilar membrane is stimulated by sound to vibrate in the cochlea. Along the basilar membrane sit neurons that are excited by this. The perceived pitch is adjusted to match the adjacent figure with the distance of the excited nerve cells from the end of the basilar membrane in relationship.
There is a linear relationship between the distance of the excited neurons from the end of the basilar membrane and the Bark value.
Approximation, the following applies:
Bark scale and signal processing of the human auditory
To determine the volume, tone or direction of sound, divides the human ear a the audible frequency range in defined areas, the so-called frequency groups. Within a frequency group is the actual information analysis, information from different frequency groups are eventually compiled into an overall impression.
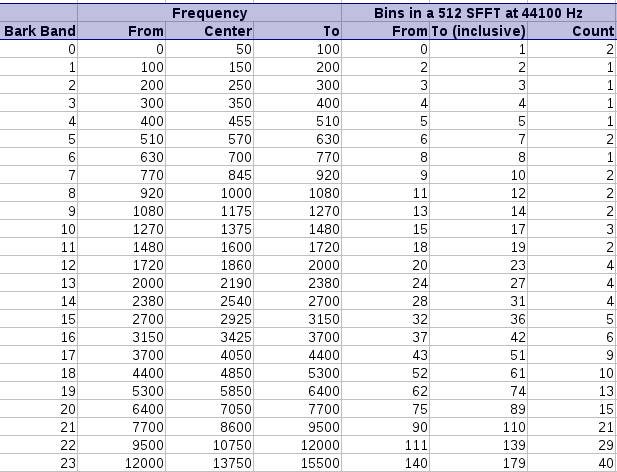
Position and width of frequency groups can be determined by listening tests. It can be observed 24 frequency groups. Position and width of the frequency groups suggest that the human ear divides the basilar membrane of the inner ear in about 24 sections of equal length, each of the nerve impulses generated are evaluated together for. However, this corresponds exactly to the definition of the Bark scale (see above):
The Bark scale is thus used to designate the different frequency groups (and hence the signal analysis regions of the ear ).
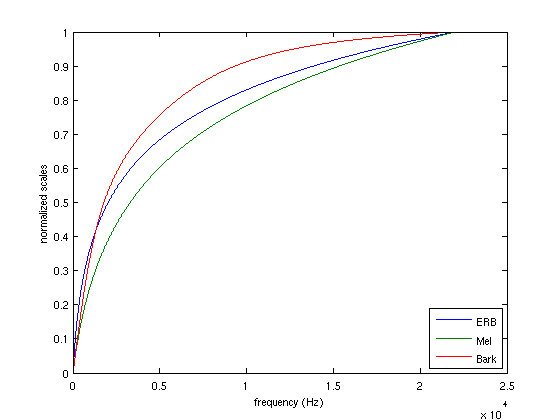
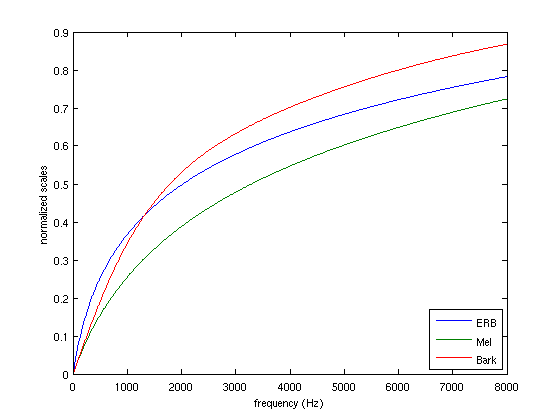
For critical bands, there are two scales: The Bark scale ( mel scale ) and the ERB scale.


