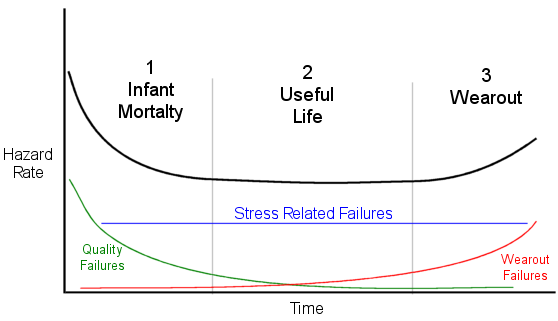
Bathtub curve
The failure distribution describes the temporal distribution, with the materials, fail, electronic or mechanical components.
Typical failure distributions are:
- The general failure distribution
- The bathtub curve
- The Weibull distribution and
- The logarithmic normal distribution.
General failure distribution
The general failure distribution is the exponential failure distribution, which is based on the exponential density function. This leads to a constant risk rate.
Bathtub effect
The bathtub effect (also: bathtub curve ) is used to describe the reliability of the technique, although the general approach is also applicable to humans. It describes a specific form of the emergency function, which contains three parts:
- The first part is a decreasing failure rate, known as early failures or infant mortality.
- The second part is a constant failure rate, known as random failures.
- The third part is an increasing failure rate, known as a symptom of old age.
This component failure as a function of time similar to the shape of a bathtub.
The bathtub curve is often modeled by three security functions,
However, it does not follow all products of this function.
Equipment life
The product life can typically be represented in a diagrammatic representation of a bathtub curve as failure rate of technical devices or systems, depending on the lifetime.
The X - axis represents the time from the beginning of the commissioning of the device, while the failure rate is applied per unit time on the Y axis. Reliable data are only possible if a statistically sufficiently large amount is used to the equipment. Over the life cycle of a product increases, the curve of the failure rate is often in the form of a bathtub to: The failure rate is at the beginning (I) and at the end ( III) of life particularly high, while it is lower and fairly constant in the period between ( II). Phase I is typically shorter than the both of the following, in which phase II can have very different time periods, depending on the design of the product.
The reasons for this effect are that design, manufacturing or material defects often noticed at the beginning of the operation or cause damage. That were not affected by such defects devices work reliably, which is why the curve flattens in the middle. End of Life Notice occur, slowly rising, reinforced failures or damage. This is mainly due to aging and wear. If this area is reached, either major repairs or replacement measures are necessary. To determine the life End of life tests can be based, for example, the Highly Accelerated Life Test.
In order to reduce the number of early failures with the user, devices can be subjected to before the completion of the production of an artificial aging. The devices are, for example, with increased ambient temperatures, increased operating voltage ( " burn-in " ) or a vibration test run.
Devices are designed to achieve a specified prior period of use. The end of the estimated useful life is ideally located at the end of Phase II, however, can be moved by variations in equipment and production quality to the front or rear.
The device failure in Phase III, due to the failure of various parts. To increase the service life, it is important to know the first fail- parts in order to specifically improve these parts. An evaluation applicable to repairs needed. Information about errors must systematically by customer service (repairs ) Go to the development department to not install the same weaknesses in the development of new devices. If this is not intense enough vulnerabilities to older product generations may remain away.
Parameters of the failure distribution
- Mean Time Between Failures
- Mean Time To Failure
- Failure In Time
Swell
- RAMS
- Production Management


