Descriptive statistics
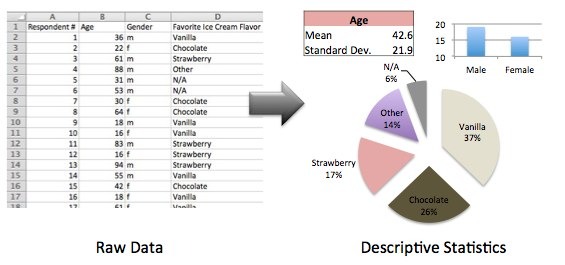
The descriptive (also: descriptive ) statistics aims to empirical data by tables, figures ( also: metrics or parameters) and graphics clearly display and organize. This is useful especially when extensive data, since this can not be easily overlooked.
Distinguish it from other branches of statistics
In addition to the descriptive statistics are statistics nor
- Exploratory data analysis (also: exploratory statistics) and
- Mathematical statistics (also: inferential statistics, inferential statistics or inductive statistics).
The exploratory statistics, has been aiming to find unknown structures and relationships in the data and thereby generate new hypotheses. This based on sample data hypotheses can then be examined in the context of statistical inference by means of probabilistic methods to their generality.
From the inductive or inferential statistics ( inferential ), the descriptive statistics differs in that it makes no claims to the above cases studied beyond the population and does not allow testing of hypotheses. The descriptive statistics used no stochastic models ( based on the inductive statistics ), so that the statements are not protected by error probabilities.
The methods of descriptive statistics can be applied, therefore, in any type of sample, while must be provided a number of conditions, including the sampling, for the methods of inductive statistics. The methods of exploratory statistics are mostly identical to those of descriptive statistics; it is rather the aim of the analysis, which both sub-regions differs.
Methods of descriptive statistics
Example of a graph: histogram of a variable
Example of a parameter: coefficient for two variables
To represent the data, there are three main methods:
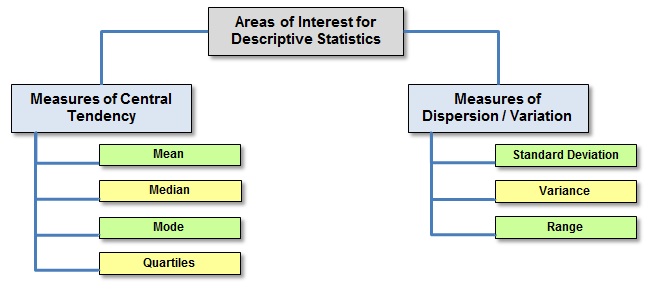
Parameters ( statistical parameters )
Three types of parameters are mainly of interest:
The choice of suitable parameters will depend on the scale or measuring the level of data and the robustness of the parameter.
Examples
- Representation of the average temperature and the temperature variations in a region with the mean value and dispersion; Specifies how often exceeded certain temperatures ( quantile ); Comparison by region and / or time periods with graphics, and tables.
- In an urn are five red and four blue balls. There are three balls drawn without replacement from this urn. If we define the random variable drawn as the number of red balls among the three, is the hypergeometric distribution with the number of red balls in the urn, as the total number of balls in the urn and a number of attempts. Here all the information about the distribution of can be obtained.


